
When we are trading, we always need to know about the direction of the price. And points where price possibly can come. We will find out this by learning about trend lines.
In previous articles, you learned about candlesticks. If not click here to read.
What is a trend?
A trend is an overall direction of an asset’s price. Trend can be an uptrend (bullish) or can be a downtrend (bearish). For example, if the price of the stock is going up, then it is an uptrend. And if the price of the stock is going down, the, it is a downtrend.
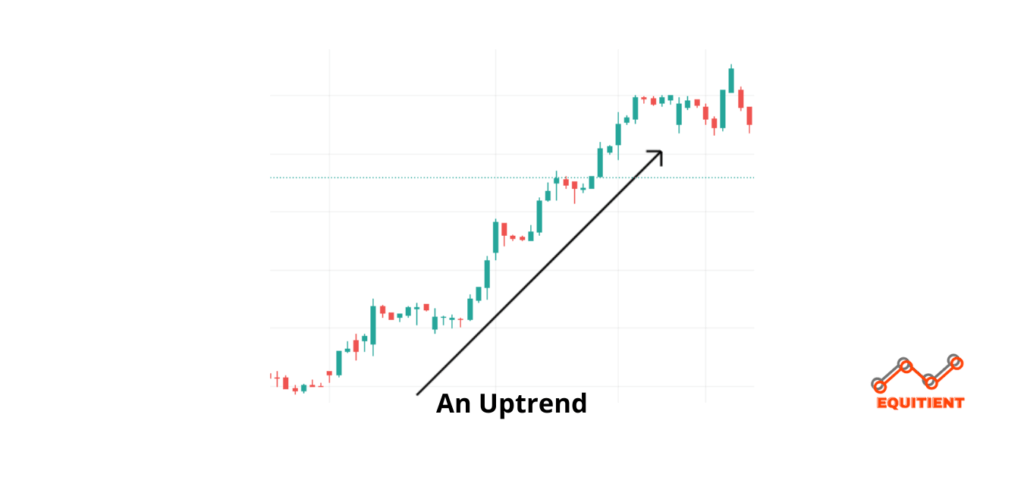
An uptrend
An uptrend is a movement of price from down to up. When the price is moving from down to up, you can say it is an uptrend.
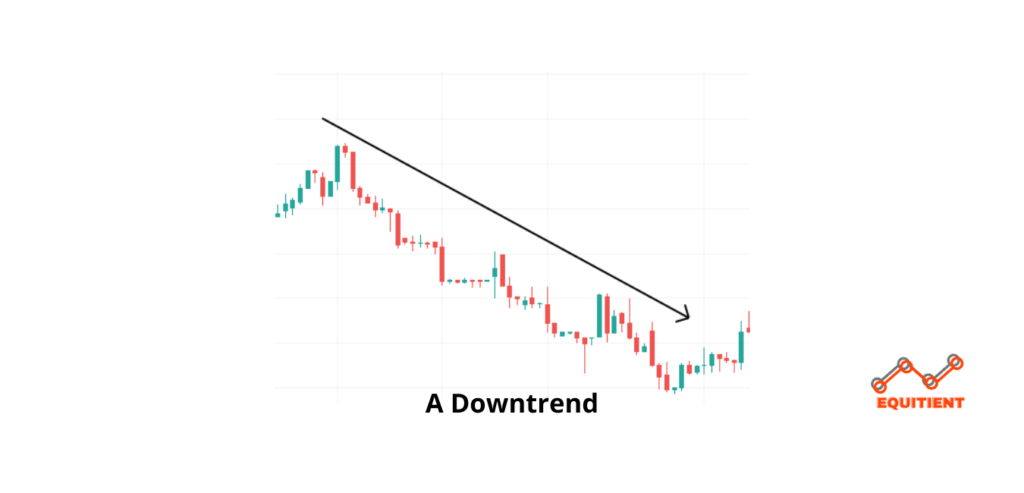
A downtrend
A downtrend is a movement of price from up to down. When the price is moving from up to down, you can say it is a downtrend.
what is a trend line?
Line which shows the direction of any trend is called as a trend line. We also called these line support or resistance lines.
How to draw trend lines?
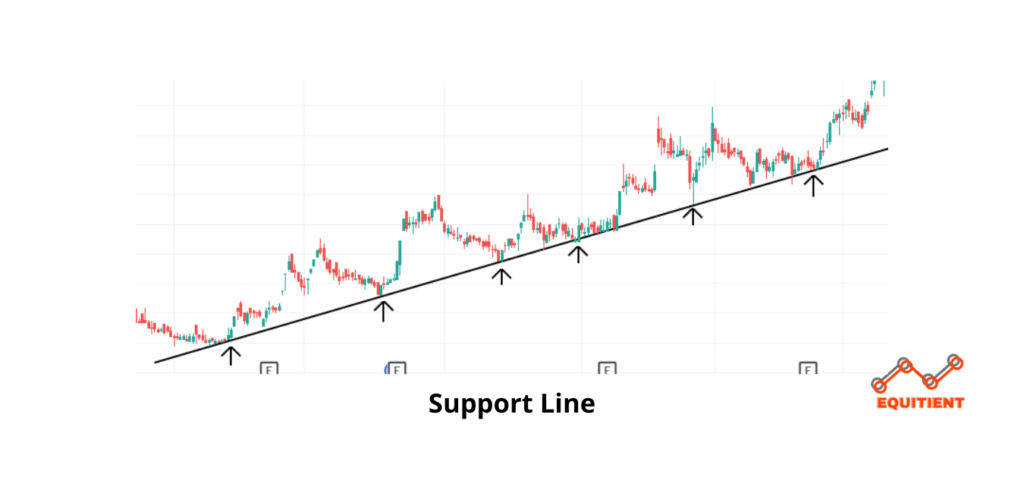
For an uptrend
For an uptrend, you have to connect higher lows of the trend. This line is also called as a support line. To make a valid support line, you have to connect minimum of 3 higher lows. More the points are touching to the support line, the better it is.
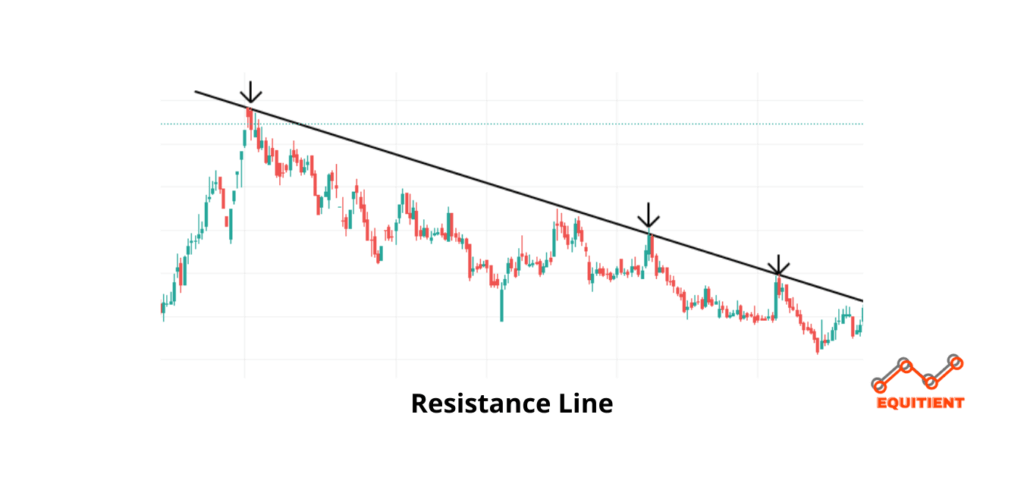
For a downtrend
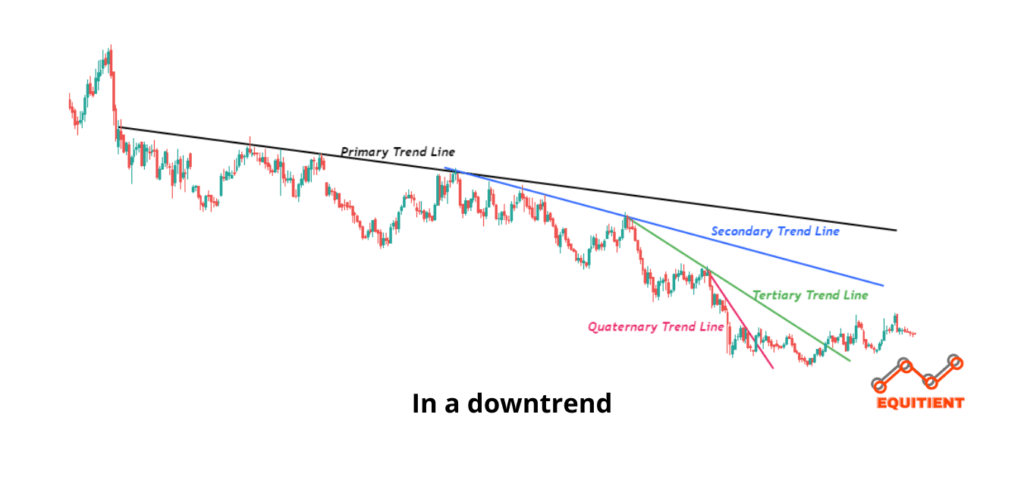
for a downtrend, you have to connect lower lows of the trend. This line is also called as a resistance line. To make a valid resistance line, you have to connect minimum of 3 lower lows. More the points are touching to the resistance line, the better it is.
You can draw multiple trend lines to a single big trend. And each trend line makes a new trend inside the big trend.
Primary trend line
Primary trend line shows the main trend. In above image, I have shown by black line.
You can draw this line by connecting first point of any trend to the next point. This trend is called as a primary trend and can last up to months to years depending on the time frame you are using for drawing trend line.
Secondary trend line
In primary trend, you may also see a secondary trend. This is a new trend inside the primary trend.
To draw a secondary trend line, you have to take a point from primary trend and you have to connect it to the secondary trend point. As shown in the image.
This trend is stronger than the primary trend and can last up to weeks to months, depending on your time frame.
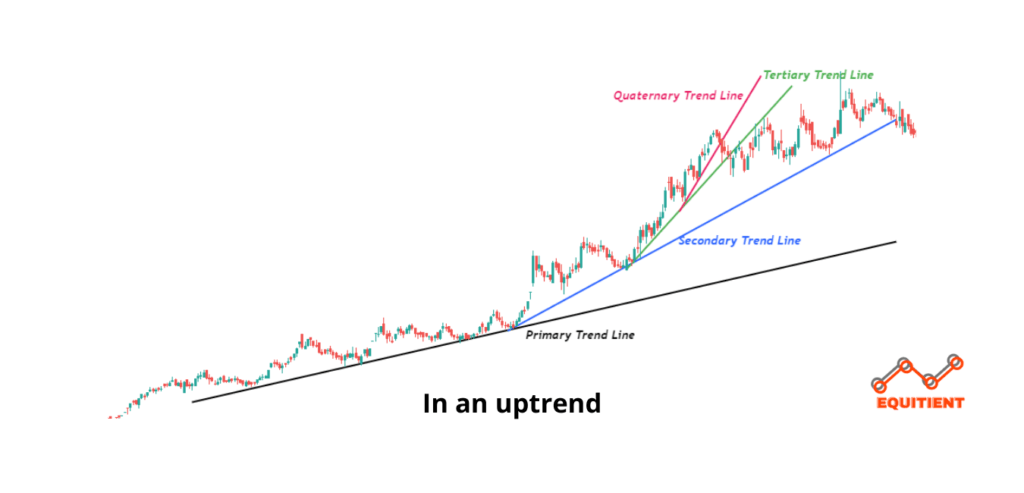
Tertiary trend line
In secondary trend, you will see the tertiary trend. This is a new trend inside the first two trends.
To draw a tertiary trend line, you have to take a point from secondary trend and you have to connect it to the tertiary trend point. As shown in the image.
This trend is stronger that first two trends and can last up to days to weeks.
Quaternary trend line
In tertiary trend line, you will see a quaternary trend line. This is a new trend inside the previous trends.
To draw a quaternary trend line, you have to take a point from tertiary trend line and have to connect it to the quaternary trend point. As shown in the image.
This is the strongest trend and can last up to hours to days.
Important Things About Trend Lines
You know that, natural movement of price of any stock is zigzag type. Like, if it is an uptrend, price will take a small correction in opposite direction. And this is natural.
We drew a primary trend line, so after some time, price should come and touch this trend line. But price didn’t. It moved and made a new smaller trend. Why?
Let’s understand this. Price made new trend by not coming to primary trend.
For an uptrend
Buyers started buying before it touches to primary trend line. And this made a new trend(Secondary uptrend). This shows buyers are not ready to give up and are not ready to wait to touch the trend line. This act of buyers show, trend has become more stronger than previous one. Similar for tertiary and quaternary trends.
For the downtrend
Sellers started selling before it touches to the primary trend line. And this made a new trend(Secondary downtrend). This shows sellers are not ready to give up and are not ready to wait to touch the trend line. Means, trend has became more stronger than previous downtrend.
Final Thoughts
Trend lines is one of the most important concept of trading. If the price is touching too many points, means that line is too important.
Strength of trends
Quaternary Trend > Tertiary Trend > Secondary Trend > Primary Trend
Time frame of trends
Primary Trend > Secondary Trend > Tertiary Trend > Quaternary Trend
These two are most important points to remember while using trend lines.