
I have divided chart patterns into four parts to make it simple for you. The first part is about Bullish Continuation Chart Patterns, second part is Bearish Continuation Chart Patterns, third is Bullish Reversal Chart Patterns and the fourth is Bearish Reversal Chart Patterns.
In this article, you are going to learn about Bullish Continuation Chart Patterns.
What are chart patterns?
Chart patterns are the formations created by the movements of security prices. Charts patterns are created by connecting closing prices, high or lows of the securities.
What are Bullish Continuation Chart Patterns?
When the price of a security rises, it is said that it’s a bullish movement. Price doesn’t move in a single direction, it always takes a small reversal or pauses. After small reversals or pauses price continues it’s direction.
These small reversals and pauses makes patterns. And these patterns are called as Bullish Continuation Chart Patterns.
Chart Patterns
1. Bullish Flag
Bullish flag is also called as a pole and flag pattern. As it looks like a flag.
First, you will see a strong upward movement, which shows the buying pressure. The you will see, stock will trade sideways for some time. The portion between black lines. Here traders are booking their profit.
In this part, you will see very small and weak candles, which shows weakness in the selling. Support and resistance line will be parallel to each others, which shows buying and selling is happening with equal amount.
After breakout, you will see the movement like first strong move.
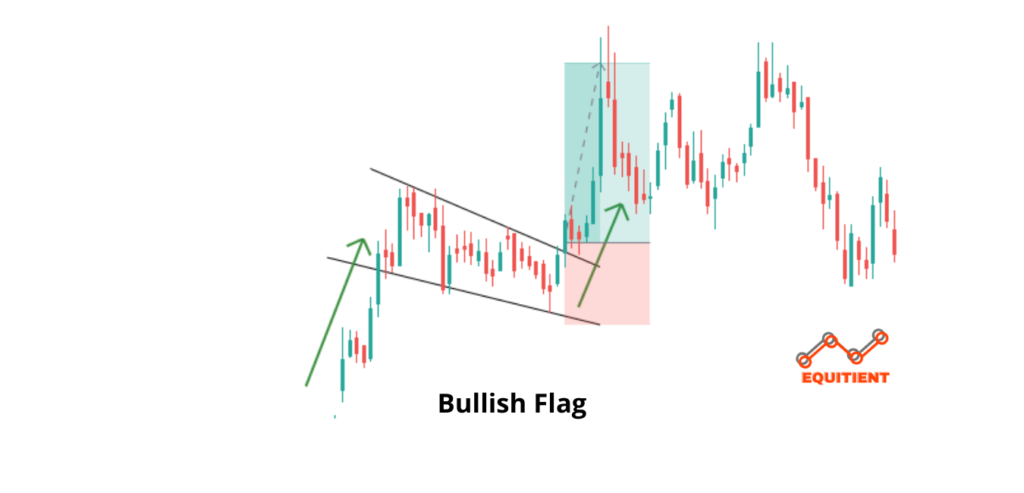
You can enter into trade, after breakout of the resistance line. Your stop loss will be the below recent low and your target will be equal to first strong movement.
2. Triangle Pattern
There are many triangle patterns such as symmetrical, ascending, etc. But they all works the same way.
Here also, first you will see a strong upward move. Which indicates buyers are strongly buying it. Then you will see a triangle like formation. Here traders are booking their profits and new trader are waiting for the opportunity.
When triangle will start formation and time will pass, you will see the price will start narrowing from buyers and sellers also. The shows both buyers and sellers are aggressively trading. You can see the portion between black lines.
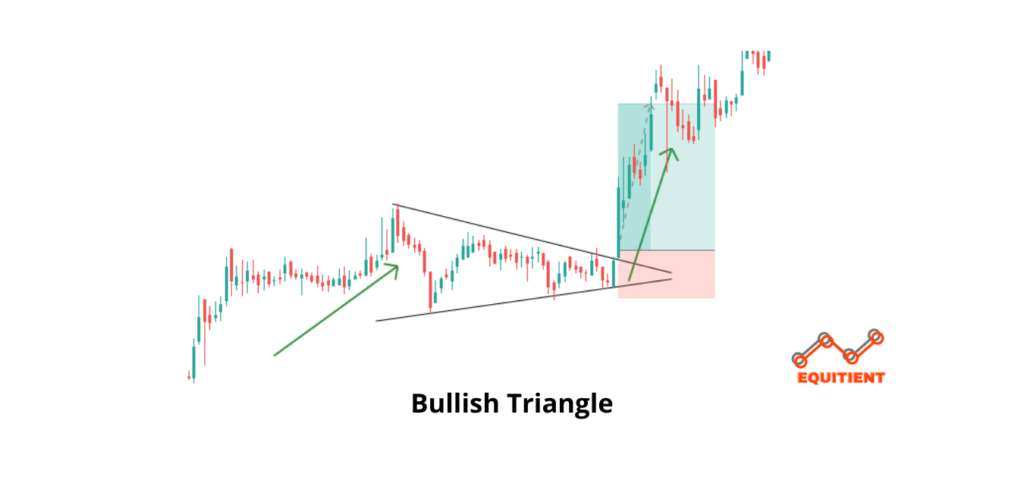
You can enter into trade after breakout of the resistance line. You stop loss will be below the recent low and your target will be equal to first move.
3. Bullish Wedge Pattern
Wedge is also a bullish continuation pattern. First move will be strong, which shows buying pressure. Then you will see a small reversal, which shows profit booking from other traders.
Here, support and resistance will not be parallel to each other. Support line will be less sloppy as compare to resistance line. This shows sellers are losing momentum and buyers are not ready to give up easily. A portion between two black lines shows this.
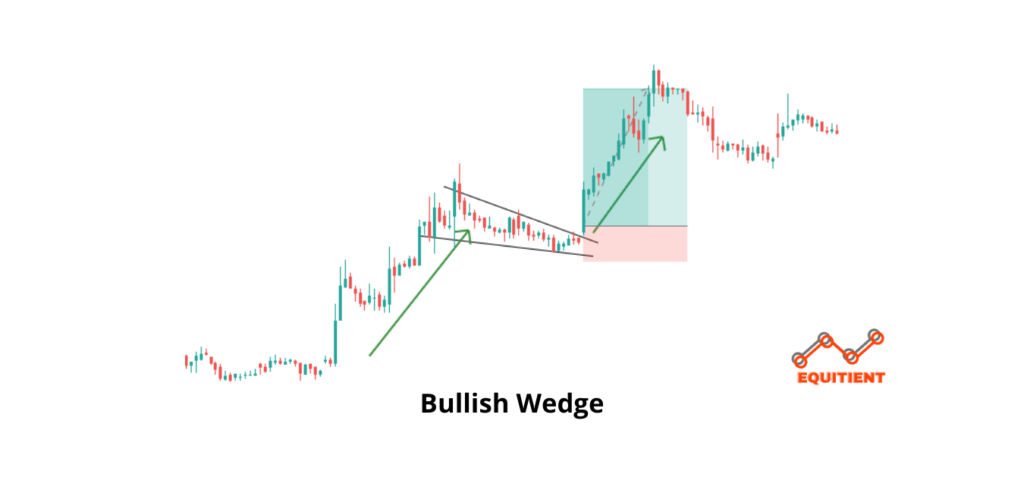
You can enter into trader after breakout of the wedge pattern. Your stop loss will be below recent low and your target will be equal to first move.
4. Bullish Rectangle Pattern
As a name suggest, this pattern will look like a rectangle. First there will be a strong upside move. Then you will see a rectangle like pattern. Here traders are booking their profits and other traders are waiting for new entry.
In rectangle, price will move in between support and resistance line. You can call these line supply and demand lines also. Here buyers and sellers will be equal.

After upside breakout, you can enter into trade. Your stop loss will be below the recent low and your target will be equal to the first move.
Final Thoughts
Learning about bullish continuation chart patterns can be the great way to start learning about patterns.
These are the continuation patterns, first there must be a strong move and then a pattern. If there will be no strong move, then your pattern may not work.
In next article, you will learn about bearish continuation chart patterns.