
In the previous article, you might have read about formation of candlesticks. If not, then read that first, as that is the base of this article. Click here to read that. In this article, you will learn about candlesticks patterns.
Candlesticks patterns are used to do technical analysis.
Candlesticks patterns get repeated over a period of time and they have certain outcome. Like, if you see a Morning Star Pattern, it’s basically a signal of reversal of downtrend to uptrend.
You will learn all the important Bullish Reversal Patterns.
Bullish Reversal Patterns
Bullish reversal patterns are the patterns, which changes the direction of the trend from bearish to bullish. All these pattern works best at support or demand lines.
White candles are bullish candles and blue candles are bearish candles.
1. Hammer
Hammer is a single candle reversal pattern which works best at the support or demand zone. You will see open and close of this candle roughly at same point. And it has a long lower shadow, which shows rejection from sellers, as buyers try to push the market higher.
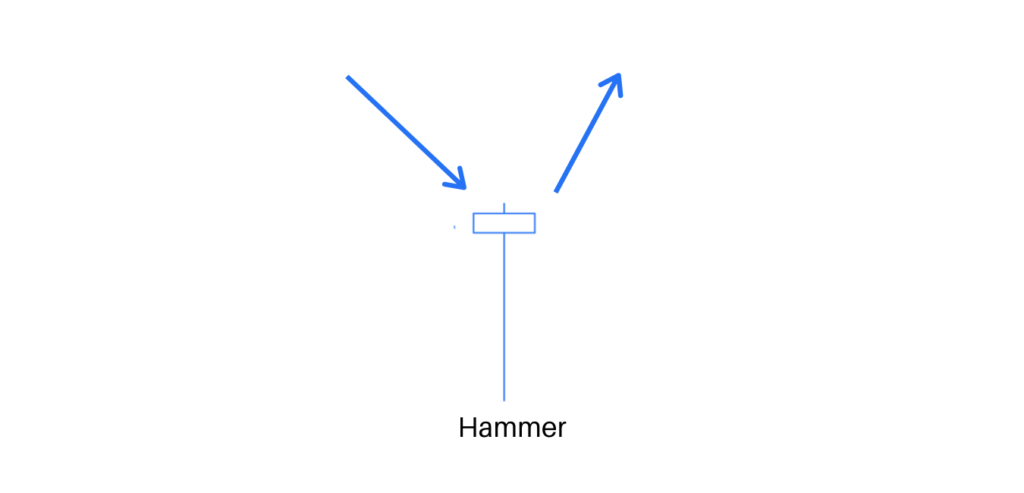
First there will be a downtrend and you will see hammer at support. When hammer candle open, sellers push the market lower. There comes a point when they stop selling, buyers takes over and pushed the market higher.
Basically it shows, first sellers were interested but then buyers take over them. Here color of the hammer doesn’t matter, you just need hammer of any color.
You can enter into trade above hammer candle.
2. Inverted Hammer
Inverted hammer pattern is a single candle pattern, which forms at support and demand level.
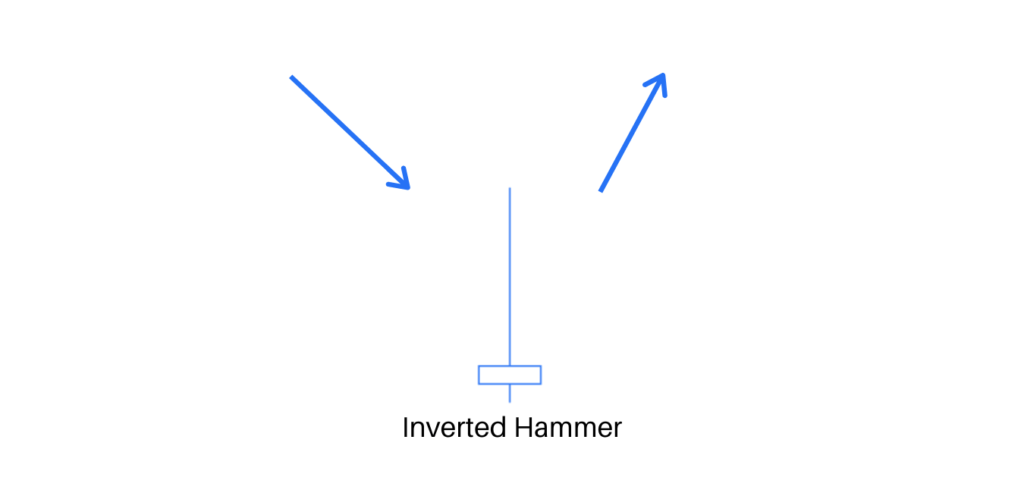
First there will be a downtrend, then you will see this pattern. Close and opening of this candle will be roughly same and there will be a long tail on upper side.
Here works revers psychology of hammer pattern. When this candle opens, buyers try to push the market higher. But then sellers comes and drag market down. Here buyers come and that’s why it acts as a reversal candle. Color of this candle doesn’t matter, it can be bullish or bearish candle.
You candle enter into trade, when the next candle closes above inverted hammer candle.
3. Bullish Engulfing
Bullish engulfing pattern is a two candle pattern. First candle will be small bearish candle and second candle will be a big bullish candle. The first candle will be completely engulfed by second candle.
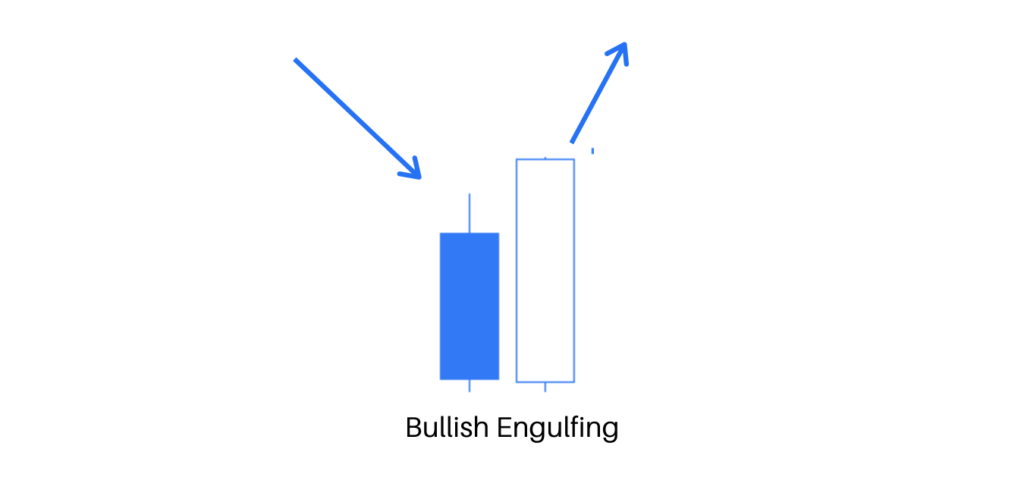
There will be a downtrend first, then you will see a small bearish candle at the support or demand line. Which shows lack of selling pressure from sellers and act as a momentum shift candle. Then you will see a big bullish candle, which engulfs first small bearish candle. Here buyers takes over the sellers.
You can enter at the close of the second candle.
4. Bullish Harami
Bullish harami candle is a two candle pattern. First candle will be a big bearish candle and second candle will be a small bullish candle. The second candle will be inside the body of first candle.
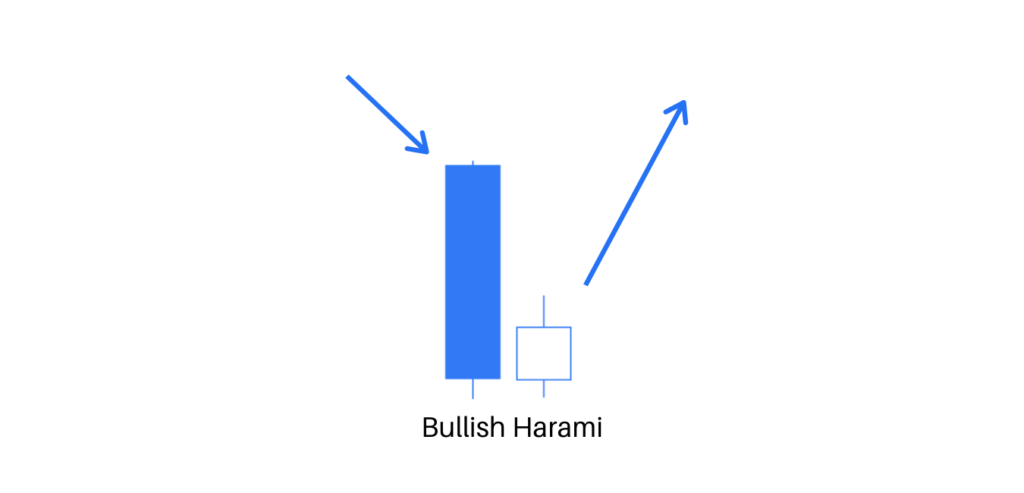
There will be a downtrend first and you will see a bearish candle at the support level. Which shows the sellers are in control. Then you will see a small bullish candle, which shifts momentum of sellers. There mush be a gap up opening for second candle and it must close below the close of the first candle.
You can enter after close of second candle.
5. Tweezer Bottom
Tweezer bottom pattern is a two candle pattern. It forms at support or demand zone. First candle will be any bearish candle and second candle will be any bullish candle.
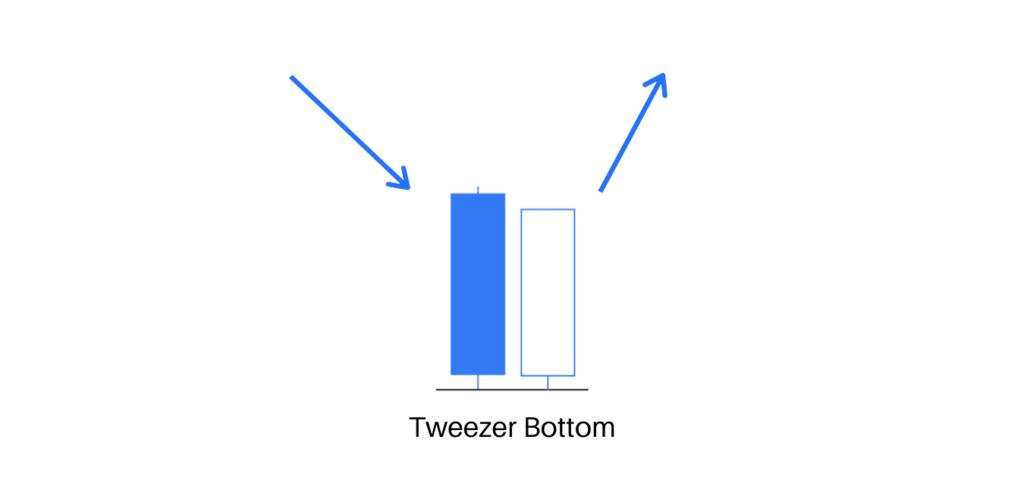
There will be a downtrend and you will see a first bearish candle at support. Second candle will be bullish, when second candle open, their low will be equal to the close of the first candle. Which shows the buyers are taking over sellers and not giving chance to move price lower.
You can enter in the trade after close of the second candle.
6. Piercing Pattern
Piercing pattern is a two candle pattern, which forms at support or demand zone. First candle will be the bearish candle and second candle will be the bullish candle.
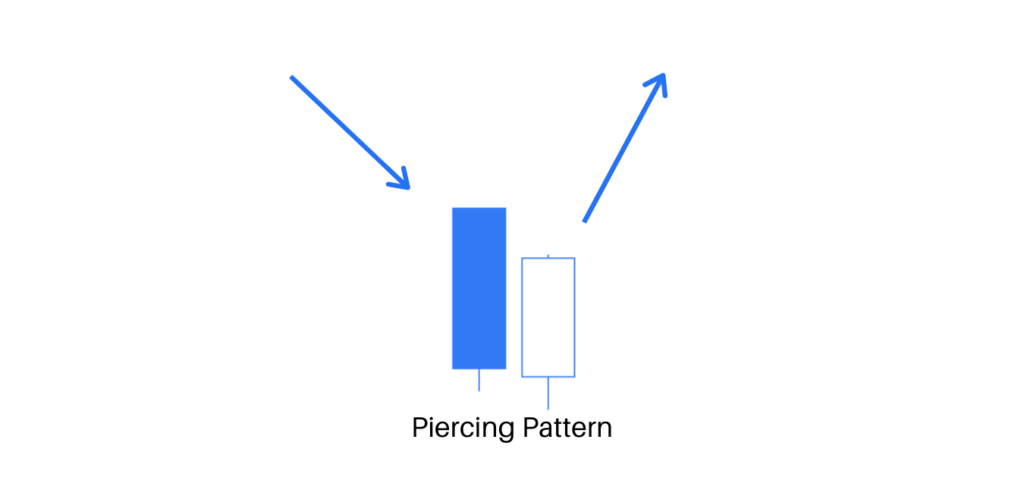
First there will be the downtrend and you will see a bearish candle at support. The next candle will be the bullish candle. You will see a gap down opening for second candle because of previous downtrend. Close of the second candle must be above the 50% of the first candle.
You can enter into trader at the close of second candle.
7. Morning Star
Morning star is a three candle pattern, which forms at the support and at demand zone. First candle will be the bearish candle. Second candle will be the small bullish candle and third candle will be the bullish candle.
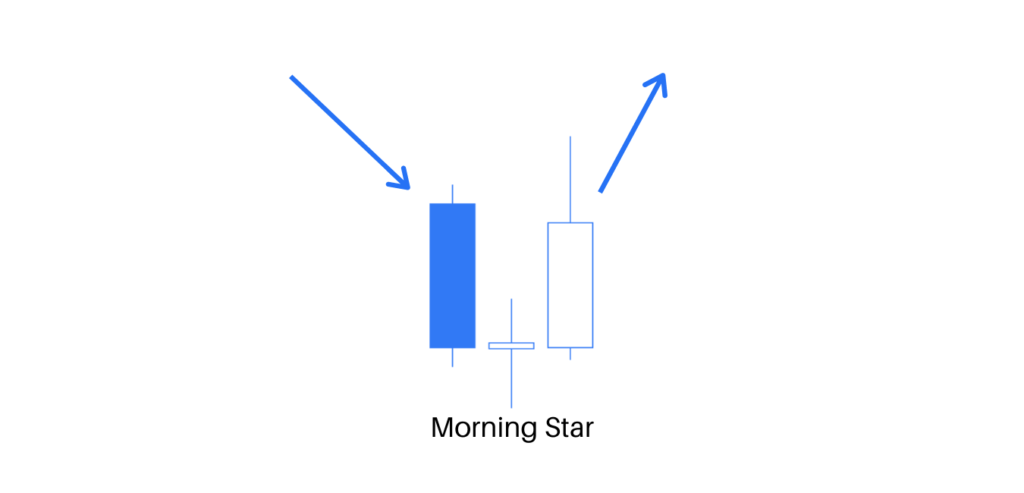
First there will be the downtrend and you will see first candle at support level. For second candle, there will be a gap down opening due to downtrend. Size of the candle will be small, this candle will act as a momentum shift candle from bearish to neutral. Third candle will be the bullish candle, which will act as confirmation candle for trend shift from bearish to bullish.
Here Color of the second candle doesn’t matter. Second candle cab be the hammer, doji, small bullish or bearish candle.
You can enter into trade at the close of third candle.
Final Thoughts
Learning candlesticks patterns is one of the most important topic in technical analysis. It tell you many things about market conditions. The most important thing is their position. Don’t trade only base on candles alone, combine candles with chart patterns also.
Where are they forming. Because you will see such patterns all over the chart, but when and where to use them is the key. In next article, you will learn about bearish reversal patterns.