
This is the last part of chart patterns. In this article you will learn about different types of reversal chart patterns. In previous articles, you learned about bullish continuation chart patterns and bearish continuation chart patterns.
What are Reversal chart patterns?
When a trend is about to reverse from a particular point, the pattern form at that reversal point is called as reversal pattern.
Let’s say, a stock is going down and at support, at formed a particular pattern. And stock reversed after that. So that pattern is called as reversal pattern.
Bullish Reversal Patterns
Bullish reversal patterns are the patterns which reverses the direction of bearish trend to bullish trend.
1.Double Bottom
First, there will be a selling, which will show a downtrend. Then at support level, you will see this pattern. Which will look like a W.
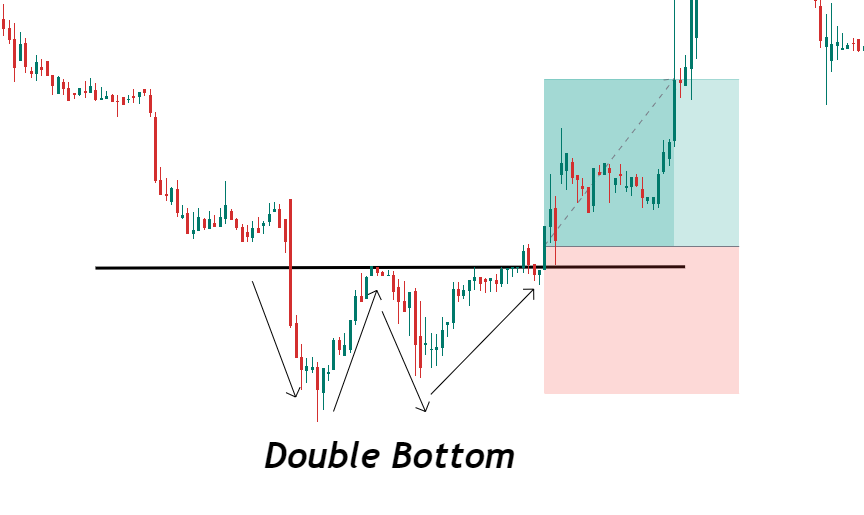
You can enter into trade after breakout of neckline. Your target will be the difference between neckline and two bottoms. And your stop loss will be below two bottoms.
2.Inverted Head And Shoulder
There will be a downtrend first, in downtrend you will see a small retracement which is left shoulder. Then you will see a continuation and reversal, which acts as a head. And at last, you will see a small retracement which is right shoulder.
Left shoulder slowdowns the selling pressure. Head act as a trend reversal and right shoulder gives momentum to buyers.
You can enter into the trade after breakout of neckline. You target is difference between head and neckline. You can place your stop loss below right shoulder.
3.Falling Wedge
In a downtrend, you will see price will start moving little bit side ways trend. Or you can say the slop will decrease, this shows decrease in selling pressure. Once sellers stopped selling, buyers look for buying and it reverses the trend.
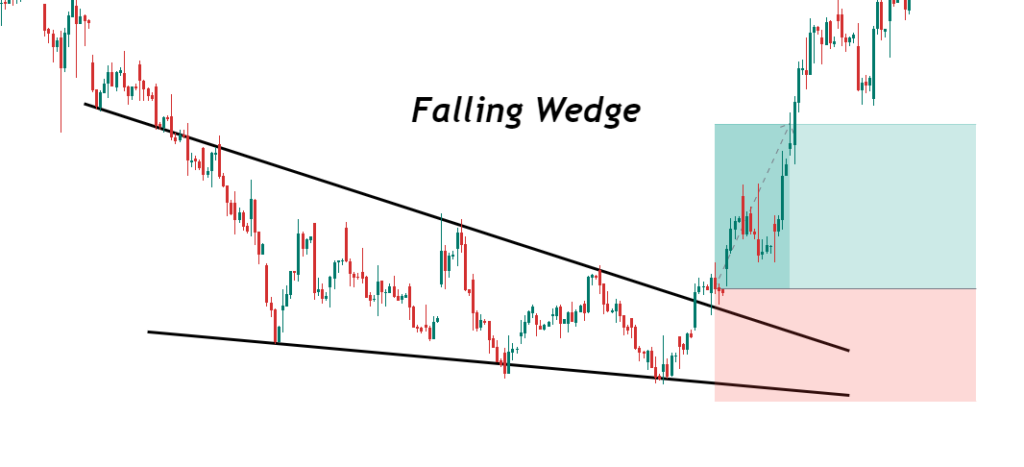
You can enter into trade after breakout of resistance line. Your target will be difference between support and resistance. You can place your stop loss below support line.
Bearish Reversal Patterns
Bearish reversal patterns are the patterns which reverses the direction of bullish trend to bearish trend.
1.Double Top
First, there will be a buying, which will show an uptrend. Then at resistance level, you will see this pattern. Which will look like M.
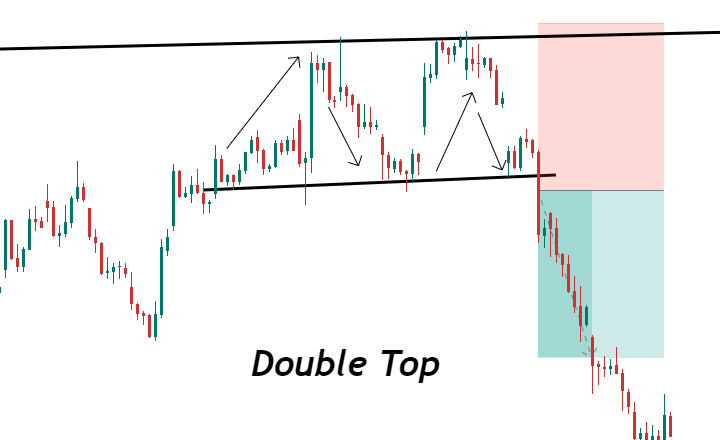
You can enter into trade after breakout of neckline. Your target will be the difference between neckline and two tops. And your stop loss will be above two tops
2.Head And Shoulder
There will be an uptrend first, in an uptrend you will see a small retracement which is left shoulder. Then you will see a continuation and reversal, which acts as a head. And at last, you will see a small retracement which is right shoulder.
Left shoulder slowdowns the buying pressure. Head act as a trend reversal and right shoulder gives momentum to sellers.
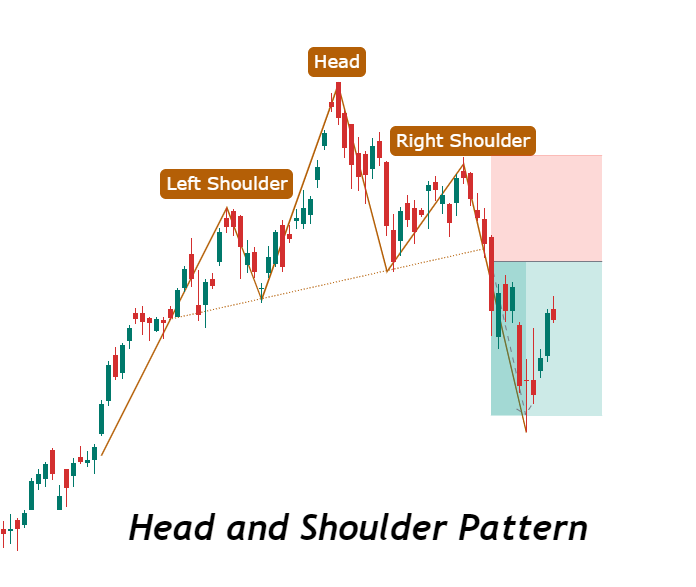
You can enter into trader after breakout of neckline. You target is difference between head and neckline. You can place your stop loss above right shoulder.
3.Rising Wedge
In an uptrend, you will see price will start moving little bit sideways trend. Or you can say the slop will decrease, this shows decrease in buying pressure. Once buyers stopped buying, sellers look for selling and it reverses the trend.
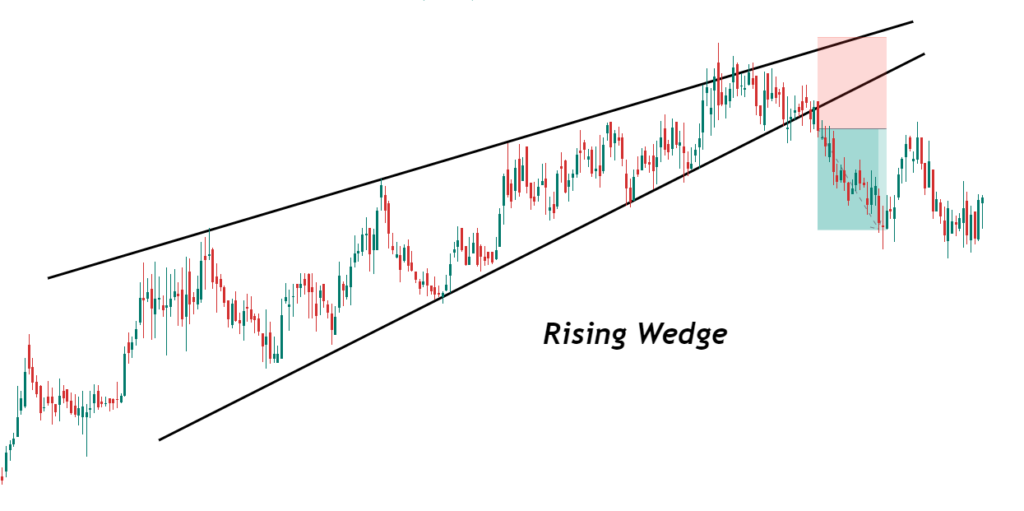
You can enter into trade after breakout of support line. Your target will be difference between support and resistance. You can place your stop loss above resistance line.
Final Thoughts
Now you have learned all the patterns, so you can trade theme easily. Reversal patterns helps a lot when we are looking for trend reversals. If you learn more about them, it will be very easy for you to trade them.